
How would a tester use Google Chrome Dev Tools
Open any website (preferably techerds.com) in Google Chrome. Right-click and select “inspect element”. A tab similar to below should appear.
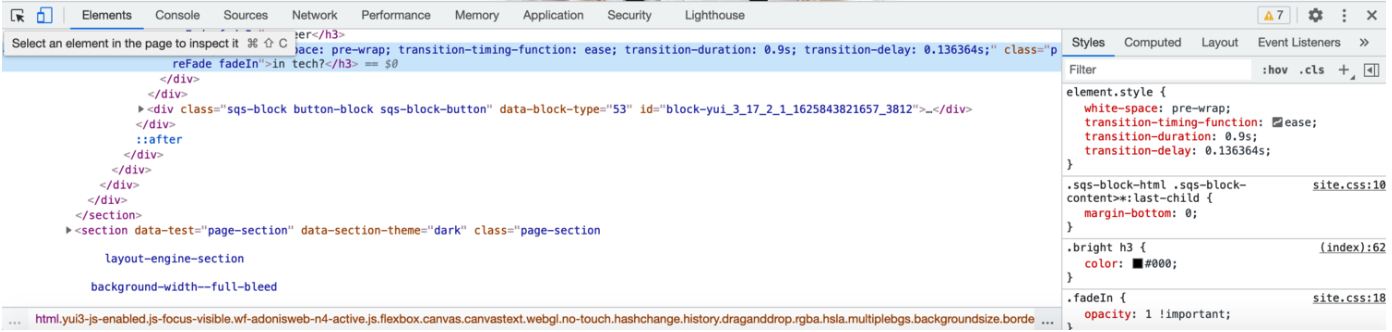
Elements - HTML that the page consists of.
Console - JavaScript interface allowing users to enter additional JavaScript as well as displaying any JavaScript errors that exist on a given page.
Sources - files and assets being called by the page.
Network - stats and details referring to the delivery of each network request the page requires.
Performance - similar to network with more in-depth controls (not something you need to worry about).
Memory - more useful for developers than testers but gives further insights into the performance of the page in the context of the application code associated with the page.
Application - provides insights into data being generated and used by the page
Security - illustrates what measures are being taken by the page to protect user data and activity on the page
Lighthouse - details relating to Google’s own page speed metrics.
See if you can find the below values for Techerds homepage.
Page load
Page size
Contents of the meta description.
If you’re confident you understand how to use all of these tools, feel free to move onto the next step.